Month: June 2015
QGIS 2.10 symbology preview
With the release of 2.10 right around the corner, it’s time to have a look at the new features this version of QGIS will bring. One area which has received a lot of development attention is layer styling. In particular, I want to point out the following new features:
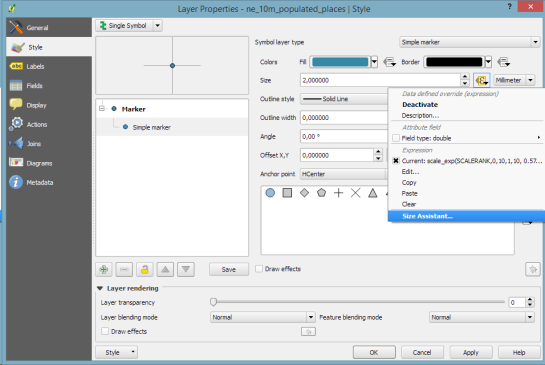
1. Graduated symbol size
The graduated renderer has been expanded. Formerly, only color-graduated symbols could be created automatically. Now, it is possible to choose between color and size-graduated styles:

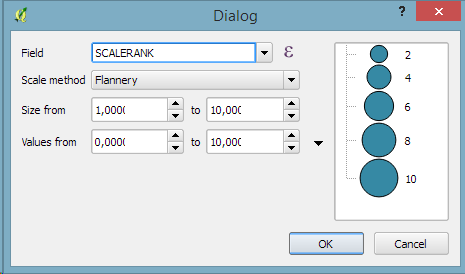
2. Symbol size assistant
On a similar note, I’m sure you’ll enjoy the size assistant for data-defined size:
3. Interactive class exploration and definition
Another great addition to the graduated renderer dialog is the histogram tab which visualizes the distribution of values as well as the defined class borders. Additionally, the user can interactively change the classes by moving the class borders:

4. Live layer effects
Since Nyall’s crowd funding initiative for live layer effects was a resounding success, it is now possible to create amazing effects for your vector styles such as shadows, glow, and blur effects:

Release of Landsat 8 Data User Handbook
Landsat 8 data users will be glad to hear that the new Landsat 8 Data User Handbook is now available online in PDF format from USGS.
Excerpted from the Handbook’s Executive Summary:
The Landsat 8 Data User’s Handbook is a living document prepared by the U.S. Geological Survey Landsat Project Science Office at the Earth Resources Observation and Science (EROS) Center in Sioux Falls, SD and the NASA Landsat Project Science Office at NASA’s Goddard Space Flight Center in Greenbelt, Maryland. Its purpose is to provide a basic understanding and associated reference material for the Landsat 8 observatory and its science data products. The document focuses on the information needed by the users to gain an understanding of the science data products.
The Landsat 8 Data User’s Handbook includes various sections that provide an overview of reference material and a more detailed description of applicable data user and product information. This document describes the background for the Landsat 8 mission as well as previous Landsat missions before providing a comprehensive overview of the current Landsat 8 observatory, including the spacecraft, both the OLI and TIRS instruments and the Landsat 8 concept of operations.
The document also includes an overview of radiometric and geometric instrument calibration as well as a description of the observatory component reference systems and the calibration parameter file, followed by a comprehensive description of Level 1 Products and product generation.
Importantly, the handbook also describes the conversion of digital numbers (DNS) to physical units. An overview of data search and access using the various on-line tools is also included.

Google Maps includes real time traffic updates for 12 more cities in India
Ever missed your movie at Priya Cinema because you were stuck in Kolkata traffic? Starting today, Google Maps can help you better plan your drive around traffic and save time on the road by showing you real time traffic information directly on the map. Today’s update to Google Maps brings you new traffic information for 12 cities in India — Kolkata, Coimbatore, Lucknow, Surat, Thiruvananthapuram, Indore, Ludhiana, Visakhapatnam, Nagpur, Kochi, Madurai, Bhopal — as well as a real time look at traffic conditions across all national highways and expressways in India.
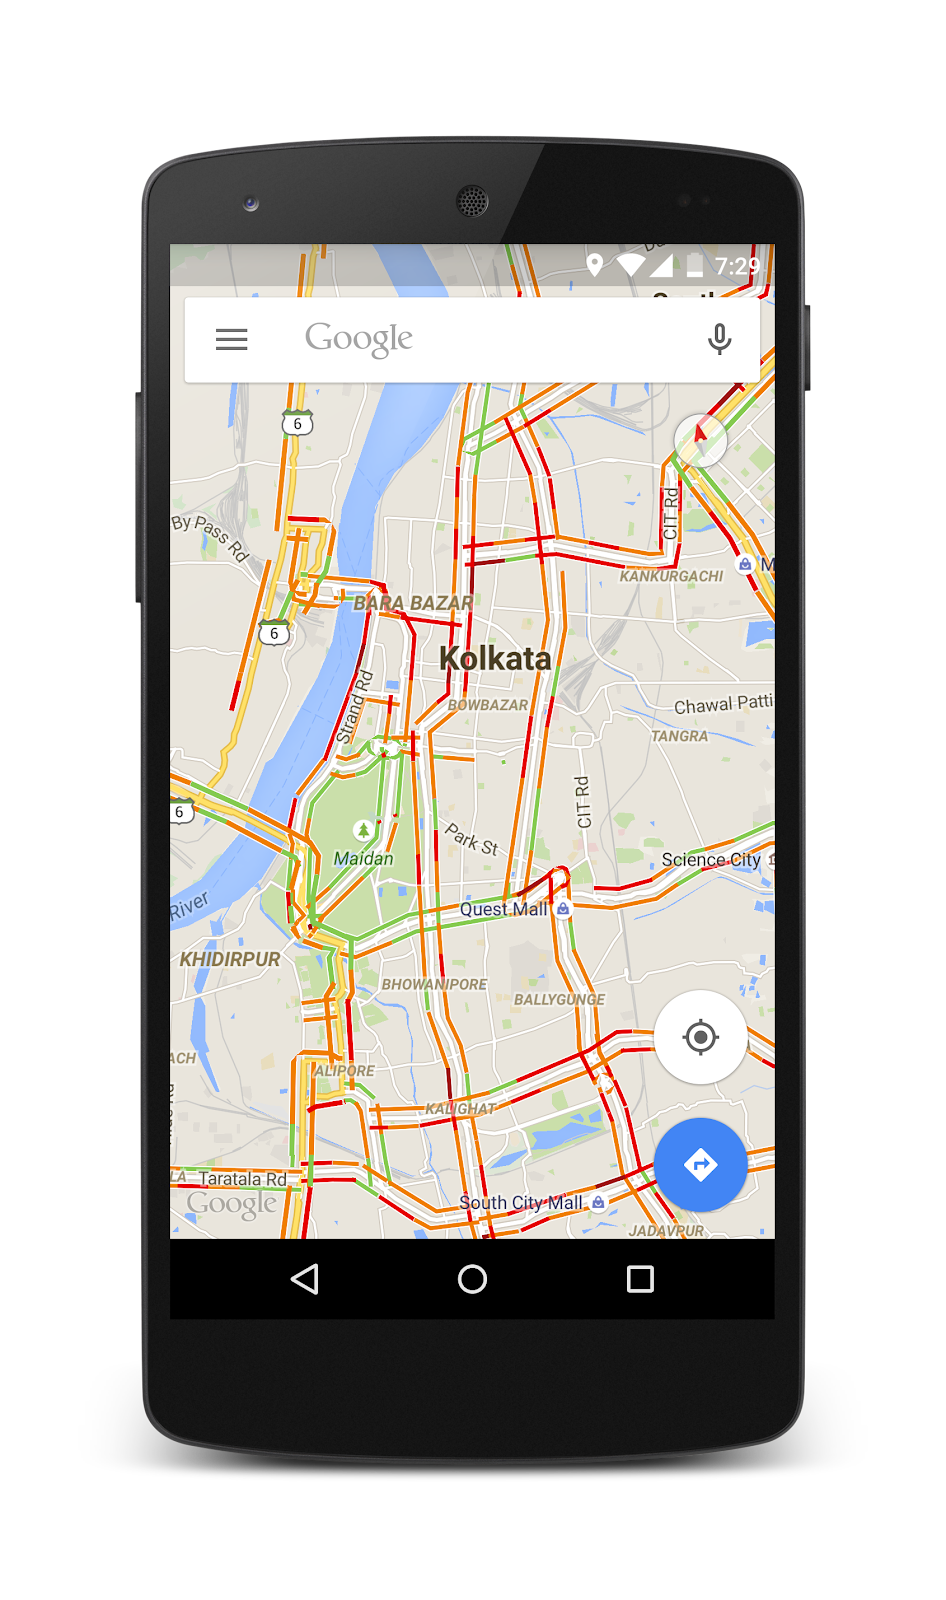
Once the Traffic layer is turned on Google Maps for mobile or desktop, you’ll be able to see routes mapped out in different colors, indicating the different speed of traffic on those roads. While green means there are no traffic delays on the road, orange indicates a medium amount of traffic and red alerts to you beware of heavier traffic congestion.
We hope this new traffic information within Google Maps will help you in planning your way around local streets and expressways. Happy traveling!
“Soil Moisture Active Passive” (SMAP) generates high resolution soil data
NASA’s new Soil Moisture Active Passive (SMAP) mission to map global soil moisture and detect whether soils are frozen or thawed has begun science operations.
Launched Jan. 31, early this year, on a minimum three-year mission, SMAP will help scientists understand links among Earth’s water, energy and carbon cycles; reduce uncertainties in predicting climate; and enhance our ability to monitor and predict natural hazards like floods and droughts. SMAP data have additional practical applications, including improved weather forecasting and crop yield predictions.

“SMAP data will eventually reveal how soil moisture conditions are changing over time in response to climate and how this impacts regional water availability,” said Dara Entekhabi, SMAP science team leader at the Massachusetts Institute of Technology in Cambridge. “SMAP data will be combined with data from other missions like NASA’s Global Precipitation Measurement, Aquarius and Gravity Recovery and Climate Experiment to reveal deeper insights into how the water cycle is evolving at global and regional scales.”
Recently launched Sentinel-2 satellite delivers First Image
Just four days after being established into orbit, Europe’s Sentinel-2A satellite delivered its first images of Earth, offering a glimpse of the ‘colour vision’ that it will provide for the Copernicus environmental monitoring programme. With a swath width of 290 km, the satellite’s first acquisition began in Sweden and made a strip-like observation through central Europe and the Mediterranean, ending in Algeria.

“This new satellite will be a game changer in Earth observation for Europe and for the European Copernicus programme,” said Philippe Brunet, Director for Space Policy, Copernicus and Defence at the European Commission.
The Director of ESA’s Earth Observation Programmes, Volker Liebig, commented, “Sentinel-2 will enable us to provide data for the programme’s land monitoring services and will be the base for a wide spectrum of applications reaching from agriculture to forestry, environmental monitoring to urban planning.”
Sentinel-2A is the second satellite for Europe’s Copernicus programme, following the Sentinel-1A radar satellite launched last year. Designed as a two-satellite mission, Sentinel-2 will provide optical imagery on a five-day revisit cycle once its twin, Sentinel-2B, is launched in 2016.
Esri to Release ArcGIS Earth to Make 3D Visualization Easy
Demand for 3D is growing. As more companies, governments, and nonprofits use 3D, it is becoming expected for communicating plans, analysis, and operational information, in fields as diverse as engineering, construction, and emergency response. Users benefit from the immersive and visually compelling experience only 3D can provide.

WHAT IS IT?
ArcGIS Earth is part of Esri’s offer for Google customers and partners looking to transition to Esri software. Along with other capabilities of the ArcGIS platform, ArcGIS Earth provides an alternative to the Google Earth Enterprise Client.
WHO IS IT FOR?
Users who need rapid access to KML and other open standard and proprietary GIS data will be able to quickly launch the app, explore data, and share information using a familiar workflow
See also ArcGIS Earth Webpage
ISRO to map heritage sites and monuments of National importance
India is a vibrant and culturally diverse country linked by vast geography and history. The evidence of country’s historic accomplishments remains visible in architecture, heritage sites and traditions that are still visited, venerated and practiced. Some of these heritage sites receive enormous global and national attention. However, many of these heritage sites face increasing risk from urbanisation, economic development and implications of unanticipated changes. The conservation of world heritage sites, ancient monuments and archaeological sites is of national importance and also helps in development and promotion of tourism, which is one of the major engines of economic growth.
Ministry of Culture, GOI has taken up a national project for inventory and monitoring of archaeological sites of the country in collaboration with Indian Space Research Organisation (ISRO). This project will help to conserve and manage thousands of heritage sites and monuments of national importance spread across in the country.
The systematic database of these heritage sites and Site Management Plans generated using space technology will help to take appropriate measures in conserving, preserving and monitoring activities of a heritage site. Such systems developed can be operationally used by the authorities responsible for the upkeep of heritage sites like Archaeological Survey of India (ASI) with least effort, time and cost implications.
The primary use of space technology in archaeology applications is in two broad areas:
- Inventory of world heritage sites and nationally important monuments in the country and generation of Geo-spatial database using high resolution satellite data
- Predictive Locational Modeling for siting prospective archaeological locations
In the present collaborative project, a Standard Operating Procedure (SOP) using high resolution satellite data as primary data source and employing state-of the-art Geo-spatial technology and open source tools is developed for operational use by ASI. It is designed as modular and scalable, allowing the SOP to evolve with the ASI’s changing institutional requirements and mandate. The project is already in advanced stage of completion in the state of Karnataka and soon will be extended to the rest of country.
Data from Cartosat-1, Cartosat-2 and Resourcesat LISS IV are used for creating the database on heritage sites and monuments. Three management zones (protected, prohibited and regulated) around the heritage site are delineated using GIS tool after locating the site/monument on the satellite image. All the landuse features within each zone are precisely mapped. Other collateral data like total station survey data, revenue village cadastral maps and other maps / attributes related to the inventory, plans etc are geo-referenced and integrated with the satellite data and form part of the geo-database. Other data like ground photographs, different views of the monuments, type of buildings and their heights, street view of the buildings and lanes, open spaces are also part of the database. Smart phone based applications are developed for geo-tagging and uploading by different stake holders and citizens as part of crowd sourcing.


