Month: August 2016
NASA: First Map of Thawed Areas Under Greenland Ice Sheet
NASA researchers have helped produce the first map showing what parts of the bottom of the massive Greenland Ice Sheet are thawed – key information in better predicting how the ice sheet will react to a warming climate.
Greenland’s thick ice sheet insulates the bedrock below from the cold temperatures at the surface, so the bottom of the ice is often tens of degrees warmer than at the top, because the ice bottom is slowly warmed by heat coming from the Earth’s depths. Knowing whether Greenland’s ice lies on wet, slippery ground or is anchored to dry, frozen bedrock is essential for predicting how this ice will flow in the future, But scientists have very few direct observations of the thermal conditions beneath the ice sheet, obtained through fewer than two dozen boreholes that have reached the bottom. Now, a new study synthesizes several methods to infer the Greenland Ice Sheet’s basal thermal state –whether the bottom of the ice is melted or not– leading to the first map that identifies frozen and thawed areas across the whole ice sheet.
(This first-of-a-kind map, showing which parts of the bottom of the Greenland Ice Sheet are likely thawed (red), frozen (blue) or still uncertain (gray), will help scientists better predict how the ice will flow in a warming climate. Credits: NASA Earth Observatory/Jesse Allen)
“We’re ultimately interested in understanding how the ice sheet flows and how it will behave in the future,” said Joe MacGregor, lead author of the study and a glaciologist at NASA’s Goddard Space Flight Center in Greenbelt, Md. “If the ice at its bottom is at the melting point temperature, or thawed, then there could be enough liquid water there for the ice to flow faster and affect how quickly it responds to climate change.”
Automating the Detection of Landslides
As farmers in Nepal prepare for the benefits of the monsoon season, Dalia Kirschbaum anticipates the dangers of those torrential rains—mainly, the loosening of earth on steep slopes that can lead to landslides. In this mountainous country, 60 to 80 percent of the annual precipitation falls during the monsoon (roughly June to August). That’s when roughly 90 percent of Nepal’s landslide fatalities also occur, according to a 2015 report from the United Nations Office for the Coordination of Humanitarian Affairs.
The Sudden Landslide Identification Product (SLIP) combs through Earth imagery and analyses consecutive images of the same location to spot changes in soil moisture, muddiness, and other surface features. The program also compares the hill slopes with topographic information derived from digital elevation models, such as those built from the Shuttle Radar Topography Mission (SRTM) and the Advanced Spaceborne Thermal Emissions and Reflection Radiometer (ASTER). By combining this information, SLIP can automatically pinpoint the locations of possible landslides each time a new, cloud-free land image is acquired.
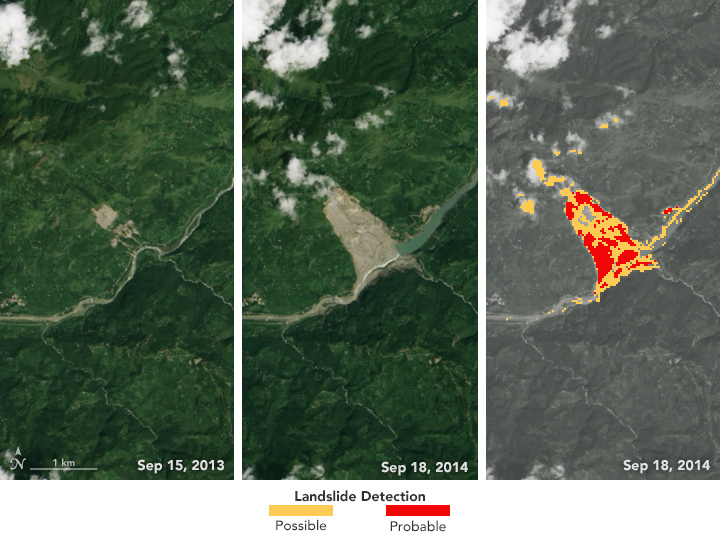
(The left and middle images above were acquired by the Landsat 8 satellite on September 15, 2013, and September 18, 2014—before and after the Jure landslide in Nepal on August 2, 2014. The image on the right shows that 2014 Landsat image processed with the new SLIP algorithm. The red areas show most of the traits of a landslide, while yellow areas exhibit a few of the proxy traits.)
What the Goddard team cannot determine from images alone is when a landslide occurred. Landsat, for instance, takes 16 days before it passes over the same spot on Earth. To more precisely pin a date on each landslide, Kirschbaum and colleagues turn to rainfall measurements from the Global Precipitation Measurement (GPM) mission. The GPM core satellite measures rain and snow several times daily, allowing researchers to create maps of rain accumulation over 24-, 48-, and 72-hour periods for given areas of interest—a product they call Detecting Real-time Increased Precipitation or DRIP. When a certain amount of rain has fallen in a region, an email can be sent to emergency responders and other interested parties.
Though still in the testing phase, the SLIP-DRIP software is open source and available to the public. Ahamed, Kirschbaum, and colleagues believe it could significantly improve landslide inventories, leading to better risk management. This information will ultimately be fed into NASA’s Global Landslide Catalog—the first and only global database of rainfall-triggered landslides. The catalogue is accessible to emergency response teams, researchers, and the public. To date, the catalogue has only included landslides reported in news outlets, online journals, and disaster databases. SLIP-DRIP products will make that information more current and comprehensive.
GIS Technology Proves Fundamental in Battle against Zika Virus
Florida is home to more than 3.6 million women aged 15 to 44 years. With more than 300 Zika virus cases reported in Florida to date, the state has become a top focus in the public health battle to curb the spread of Zika infections in the United States. Gathering and mapping such data—using GIS software from Esri—is part of the US Department of Health & Human Services (HHS) Office of the Assistant Secretary for Preparedness and Response (ASPR) effort to combat this growing health risk domestically and internationally.

The health impacts of the Zika virus are greatest on developing fetuses. Drawing on US Census data, Esri is showing experts at the ASPR and other agencies within HHS where best to target information and reach women of child-bearing age and their partners. To plan for the domestic assistance that states may need, ASPR also is using Esri software to monitor the spread of the Zika virus across the United States and in 34 other countries where infections have been found.
Using Esri software, ASPR created a publicly available interactive map that shows the number of cases in each state. The information is automatically updated each week.
The Zika virus is spread to people primarily through the bites of infected Aedes aegypti mosquitoes; however, the virus has also been found to be transmitted sexually. The virus can cause Guillain-Barré syndrome in adults and children and can cause a serious birth defect called microcephaly.
“Prevention is the first course of action in protecting public health, but people need information to make decisions about what preventive actions to take,” said Este Geraghty, chief medical officer and health solutions director, Esri. “Using GIS technology to locate the most vulnerable populations is a first step in educating people on the risks of the Zika virus and about actions that can protect health and curb the spread of disease.”
For more information on Esri and using GIS for vector-borne disease surveillance and control, visit go.esri.com/pr-zika.
Climate Change Initiative: Open Data Portal
Climate change is arguably the greatest environmental challenge facing us in the twenty-first century. The consequences of a warming climate are far-reaching, potentially affecting freshwater resources, global food production and sea level. Threatening impacts on the natural environment and life on Earth for generations to come, climate change is high on political, strategic and economic agendas worldwide.

The Need for a Global Observing System
Systematic international coordination of weather and climate observations began around the middle of the 19th century and advanced rapidly in the 1960s and 1970s as the advent of digital computers and EO satellites inspired the establishment of the operational World Weather Watch and the Global Atmospheric Research Programme. The great step forward came in the 1980s with the realisation that understanding and predicting climate would require the involvement of a much wider set of scientific communities and comprehensive observation of the entire atmosphere-ocean-land climate system.
Improved understanding of the Earth system – its weather, climate, oceans, land, geology, natural resources, ecosystems and natural and human-induced hazards – is essential if the international climate community is to better predict, adapt and mitigate the expected global changes and their impacts on human civilisation.
Scientists concerned with climate variability and change have, from the very beginning, recognised the importance of observations to the understanding of the atmosphere and the application of atmospheric science to human affairs. Without accurate, high-quality observations on all time and space scales, climate science and services could make only limited progress.
Global Climate Observing System
The Global Climate Observing System (GCOS), was formally established in 1992 by the World Meteorological Organization (WMO), Intergovernmental Oceanographic Commission (IOC), United Nations Environment Programme (UNEP), and International Council for Science (ICSU), as an international, interagency interdisciplinary framework for meeting the full range of national and international needs for climate observations. To meet the need for a systematic observation of climate, the GCOS programme developed the concept of the Essential Climate Variable (ECV). An ECV is a physical, chemical or biological variable or a group of linked variables that critically contributes to the characterization of Earth’s climate.
The Response from Space Agencies
GCOS is progressing the systematic definition of climate information needs in support of the UNFCCC, while Committee on Earth Observation Satellites (CEOS) and Coordination Group for Meteorological Satellites (CGMS), in the form of the Joint CEOS/CGMS Working Group on Climate (WGClimate), is coordinating the planning of the satellite contribution to fulfilling them. To respond to this UNFCCC and GCOS need for climate data, the European Space Agency (ESA) has undertaken the Climate Change Initiative programme. The objective of the Climate Change Initiative is to realise the full potential of the long-term global Earth Observation archives that ESA together with its Member states have established over the last thirty years, as a significant and timely contribution to the ECV databases required by UNFCCC. It ensures that full capital is derived from ongoing and planned ESA missions, including ERS, Envisat, the Earth Explorer missions, relevant ESA-managed archives of Third-Party Mission data and the Sentinel constellation.
The full suite of CCI data products can be accessed via the dedicated CCI ECV project sites : Aerosol,Cloud, Fire, Greenhouse Gases, Glaciers, Ice Sheets, Land Cover, Ocean Colour, Ozone, Sea Ice, Sea Level, Sea Surface Temperature, and Soil Moisture. All CCI data is free to download from these sites and registration procedures, where applicable, are kept to a minimum.
Changes in Landsat Collections
During the summer of 2016, the USGS has made changes to manage the Landsat archive as a tiered Collection of Landsat data. A Collection will provide a stable environmental record. If significant radiometric or geometric changes are required, all data will be reprocessed and a new Collection will be released. The tiered structure clearly identifies the subset of the Landsat archive that meets radiometric and geometric criteria suitable for time series analysis and the creation of data stacks/cubes, while continuing to provide access to the entire Landsat archive.
Starting with Collection 1, every Landsat 4-5 (L4-5) Thematic Mapper (TM), Landsat 7 (L7) Enhanced Thematic Mapper Plus (ETM+), and Landsat 8 (L8) Operational Land Imager (OLI)/Thermal Infrared Sensor (TIRS) scene is assigned to a specific tier. There are many changes being implemented to Landsat Level-1 data products to support this effort, including new Landsat Product Identifiers, “Collection” and “Tier” designations, metadata changes, and additional supporting files included with Level-1 data products. Higher level products will inherit characteristics of the Level-1 data products.

(http://landsat.usgs.gov/index.php)
Collection 1 Tiers
Landsat Tiers are the inventory structure for Landsat Collection 1 Level-1 data products and are based on data quality and level of processing. The purpose of the tier definition is to (1) support rapid and easy identification of suitable scenes for time-series pixel level analysis and (2) provide a holding zone for real-time data prior to the availability of definitive calibration information.
Tier 1
Landsat scenes with the highest available data quality are placed into Tier 1 and are considered suitable for time-series processing analysis. Tier 1 includes Level-1 Precision Terrain (L1TP) processed data that have well-characterized radiometry and are inter-calibrated across the different Landsat sensors. The geo-registration of Tier 1 scenes will be consistent and within prescribed tolerances [≤12m radial root mean square error (RMSE)].
Tier 2
Landsat scenes not meeting Tier 1 criteria during processing are assigned to Tier 2. This includes Systematic Terrain (L1GT) and Systematic (L1GS) processed scenes, as well any L1TP scenes that do not meet the Tier 1 specifications due to significant cloud cover, insufficient ground control, and other factors. Users interested in Tier 2 scenes can analyze the RMSE and other properties to determine the suitability for use in individual applications and studies.
New Landsat Product Identifiers

The Scene ID will remain in the metadata file (MTL.txt) delivered with the Level-1 data product. The heritage Scene ID will also be visible and searchable (along with the new Collection 1 Landsat Product ID) in the online metadata on EarthExplorer.
Processing Level Designation Changes

Mine Removal Drone
The Mine Kafon Drone (MKD) offers an innovative solution to landmine removal, providing a reliable demining system that delivers accurate updates and information on mine clearing operations. Mine Kafon Drone: an unmanned airborne demining system, uses a three step process to map, detect and detonate land mines.
The Mine Kafon Drone flies over dangerous areas to map, detect and detonate land mines from a safe distance. The drone works autonomously equipped with three separate interchangeable robotic extensions. These three methodologies combined makes the MKD up to 20 times faster than traditional demining technologies. As well as being safer, it also up to 200 times cheaper.

1. Mapping
First, the drone flies over the whole field with an aerial 3D mapping system to identify all the dangerous areas with GPS way points.

2. Detection
Equipped with a robotic metal detecting arm the MKD hovers above the ground at approximately 4 cm to detect mines. Every detected mine is geotagged on the operator’s system to construct a map of known mine locations.
3. Destroying
For the final phase of the process the MKD, attached with a robotic gripping arm, places a small detonator on every detected mine. The land mine is then detonated from a safe distance using a timer.

Today, landmines can still be found in more than 60 countries, constituting a significant risk to communities across the globe. In these countries, the victims are mostly civilians – children, women and the elderly – with tens of thousands of innocent people killed every year, and much more injured, serving as a horrific reminder of the past.
Using current technologies, clearing or even detecting all land mines across the entire world would take over 1100 years. The established processes are slow, dangerous and expensive, and completely unacceptable if we want to solve the problem in our lifetime.
Arctic Risk Map Details Environmental Vulnerability
Energy consumption is projected to increase 56% by 2040, and fossil fuels are expected to provide almost 80% of the world’s energy during that time, according to the US Energy Information Administration. With ice melt in the Arctic opening up navigable waters for longer periods each year, the region offers increasing opportunities for business ventures in the oil and gas industries and shipping. The Arctic has substantial hydrocarbon reserves. Traversing its waters would also yield faster shipping routes. But the area is subject to harsh and unpredictable weather and has a unique ecosystem. So any development there must be analyzed for risks and vulnerabilities while safeguarding life, property, and the environment.

Restrictions in the Arctic
The map details the potential limitations of future Arctic activities, such as development and transport. Data in The Arctic Risk Map includes the seasonal distribution of ice, meteorological and oceanographic conditions, sea ice concentrations, biological assets, shipping traffic, and oil and gas resources. This scientific data comes from numerous predictive climate and oceanographic models from organizations such as the National Oceanic and Atmospheric Administration (NOAA), the European Union’s COPERNICUS program, and the Computational and Information Systems Laboratory (CISL) of the National Center for Atmospheric Research (NCAR).


An Environmental Vulnerability Index
As shorelines and channels acquire less ice, Arctic animals become more vulnerable to various ventures that encroach on their territories. Walrus, polar bears, seals, belugas, and narwhals are all Arctic dwellers—along with many other species that are threatened or on the verge of becoming threatened because of changes in their environment.
The Arctic Risk Map includes data on where fish, mammals, and seabirds breed, feed, live, and migrate. The map is broken into 17 Large Marine Ecosystems (LMEs), a decades-old concept that the Arctic Council adopted to encourage an ecosystem-based approach to management in the region. The Arctic Risk Map‘s environmental vulnerability index combines wildlife data with a map of the LMEs to let users see how external factors, such as oil spills, would affect these species and their habitats. It also shows where shipping lanes and wildlife habitats increasingly overlap.
