Month: February 2016
Chhattisgarh to map water bodies to boost pisciculture
The government of Chhattisgarh will undertake a survey using remote sensing technology for mapping the location of ponds, rivers and other water bodies to encourage fish farming in the State.
“The State has sufficient number of ponds, water bodies and rivers to produce fish of any variety. Therefore, the government is carrying out a remote sensing survey to identify location of these water bodies to use them for fish rearing,” a government official said here Wednesday.
Four tonnes of fish are being produced at each cage culture. So far, 475 tonnes fish was produced this way, he added. Farmers from Odisha, Maharashtra, Jharkhand, Bihar, Tamil Nadu, Andhra Pradesh, Uttar Pradesh, West Bengal and Himachal Pradesh had visited the State to learn the technique. — PTI
Digital maps of water bodies will be prepared using remote sensing technology
GeoMesa: Store, Index, Query, Transform Spatio-Temporal Data
GeoMesa is an open-source, distributed, spatio-temporal database built on a number of distributed cloud data storage systems, including Accumulo, HBase, Cassandra, and Kafka. Leveraging a highly parallelized indexing strategy, GeoMesa aims to provide as much of the spatial querying and data manipulation to Accumulo as PostGIS does to Postgres.

Assessing the damage from sea level rising
Coastal areas always have been vulnerable to flooding, but likely will experience increased risk in the future due to anticipated impacts of climate change, such as sea-level rise and increased storm and rain intensity.
Population densities in coastal regions have increased almost 40 percent in the United States since the 1970s and are expected to rise 8 percent more by 2020, according to NOAA. Therefore, a higher percentage of people will be at risk to flooding and other coastal hazards in the future.
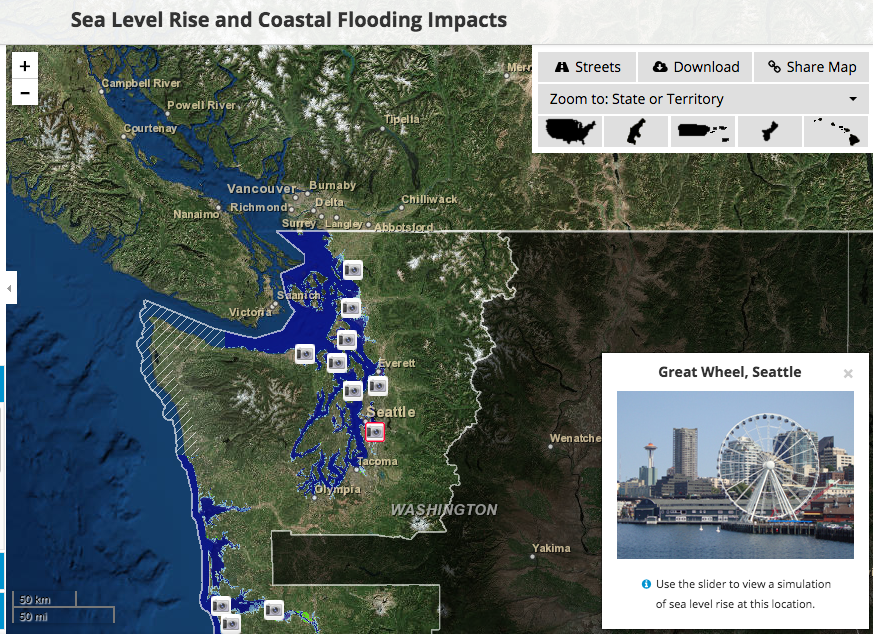 Available mapping tools
Over the past five years, a few easy-to-use interactive maps showing sea level rise inundation projections and other coastal hazards have become available online. These include Climate Central’s Surging Seas Risk Finder, NOAA’s Sea Level Rise and Coastal Flooding Impacts Viewer and the Nature Conservancy Coastal Resilience mapping portal.
How should these maps be used? Visualizing uncertainty
Sea-level rise maps indicating areas potentially prone to future inundation are valuable tools for decision makers. Interactive maps can be used as outreach tools to increase public education and awareness about coastal hazards or to evaluate areas that are vulnerable to coastal hazards on larger geographical scales (global, national or state).
These maps are also very good for providing education on the effects of sea-level rise. However, higher resolution mapping is needed to make specific decisions at the local level, for example, at the scale of siting a building or energy substation. This is partially because the sources of error and specifics about the amount of error in the models and data are often underrepresented when people look at these maps, often due to difficulty visualizing and explaining uncertainty.
Mapping Indigenous Territories in Africa
“Nonliterate Tribe in Congo Basin Saves Sacred and Medicinal Trees”
While the world’s indigenous people are estimated at only around 370 million, or about 5 percent of the global population, they reportedly speak 95 percent of the world’s languages. Yet they remain virtually unrepresented both politically and economically. Often, their lives and livelihoods are under threat from the competing economic needs of others living within their countries. But with increased attention from the United Nations, nonprofit organizations, and volunteer groups, greater awareness and understanding of the rights of indigenous people have emerged at the international level, providing them with some legal standing.
Photo : With their territory mapped, the Mbendjele tribe can protect treasured trees from being cut down by logging companies. (Photo courtesy of Gill Conquest.)
Challenges to Mapping Indigenous Territories
Since 1994, Lewis has worked as an anthropologist with the Mbendjele, a nonliterate group of indigenous hunting and gathering people living in the Republic of the Congo.
“Logging has been imposed over the lands of indigenous people across the region,” said Lewis. “The legal system hardly recognizes the rights of local people.”
One of the local logging companies, Congolaise Industrielle des Bois, chose in 2006 to become Forest Stewardship Council certified, which identifies the company as environmentally and socially sustainable in its forestry operations. Part of the certification requires that the company respect the rights and resources of indigenous and local forest people.
An Intuitive Mapping Application
To help clear up these communication issues, Lewis developed an icon-driven mapping application that the Mbendjele could use to map their key resources and protect them from logging-induced damage. While this application worked for several years, by 2013 the software and hardware were outdated. So Lewis and Haklay founded the ExCiteS team to create more durable mapping solutions for the Mbendjele and other indigenous peoples.
Telling Stories with Maps
Stories are a very important aspect of our society, and storytelling is one of the things that make us uniquely human. Stories convey important knowledge about the world around us, often in a simplified yet dramatic fashion designed for maximum impact. We have much to learn, remember, and understand in life, but wrap a great story around something and it will make an impression on us that lasts a lifetime.
– Allen Carroll, Esri
So where do maps fit in the storytelling realm?
Story maps use geography as a means of organizing and presenting information. They tell the story of a place, event, issue, trend, or pattern in a geographic context. They combine interactive maps with other rich content—text, photos, video, and audio—within user experiences that are basic and intuitive.
Sentinel-3A to provide Earth observation data worldwide & Free of cost
Sentinel-3 will provide high-accuracy optical, radar and altimetry data for marine and land services, measuring variables such as sea surface topography, sea- and land-surface temperature, ocean colour and land colour with high-end accuracy and reliability. The first
Sentinel-3 satellite (S-3A) was launched on 16 February 2016 and is supporting ocean forecasting systems, as well as environmental, agriculture and climate monitoring. A second satellite (S-3B) is scheduled for launch in 2017.

The mission is expected to begin operations in five months, delivering Earth obseration data worldwide and free of charge for all users.
The Sentinel-3A satellite will deliver data within three hours of sensing, 24 hours a day, 365 days a year. While these data will be fed primarily into the Copernicus Marine Environment Monitoring Service, all the Copernicus services will benefit from it, as the satellite will systematically measure also Earth’s land, ice and atmosphere with a suite of cutting-edge instruments.
Coal India to use drone for exploration
Coal India is planning to start using drones to conduct aerial surveys of blocks that come up for exploration and to assess the extent of greenery restored after mines are closed, helping it to cut costs and save time.

Drones can also be used to replace data captured by satellites in terrain where data is not very clear. Being at such heights, satellites do not always capture data that can be useful – drones can replace them. Such data would be used to generate geological reports, which need to be submitted to the government before exploration is initiated in any block. Capturing data electronically would help streamline the data and it would be more organised than manual operations.
Coal India also plans to use drones to assess the level of coal stocks at its yards to help determine how much has been liquidated or added.
Read more
An Earthling’s Guide to Black Holes
Welcome, earthlings, to the place of no return — a region in space where the gravitational pull is so strong, not even light can escape it. This is a black hole.
It’s ok to feel lost here. Even Einstein — whose Theory of General Relativity made it possible to conceive of such a place — thought the concept was too bizarre to exist. But Einstein was wrong, and here you are.

Image: NASA’s Hubble Space Telescope captured a high energy blast, likely a black hole eating, at the center of a galaxy. Credit – NASA
It swallows up everything too close, too slow or too small to fight its gravitational force — even light. With every planet, gas, star or bit of mass consumed, the black hole grows.
At the edge of a black hole, its event horizon, is the point of no return. Stay far away from the event horizon, because that’s where the hole pulls in light. And nothing is faster than light. At the event horizon, everything enters the black hole.
Copernicus Global Land Service
The Copernicus Global Land Service is the component of the Copernicus Land service which ensures a global systematic monitoring of the Earth’s land surface. It provides bio-geophysical variables in near real time describing the state of vegetation, the energy budget and the water cycle, including their changes and disturbances, derived from the imagery of low and medium resolution satellite sensors.
The Global Land Service is a component of the Copernicus Land service that provides a series of bio-geophysical products on the status and evolution of land surface at global scale at mid and low spatial resolution. Products are mentioned below.
VEGETATION STATE products
Bio-geophysical variables to understand ecosystem dynamics, estimate crop yield, manage natural resources, assess global land carbon budget and to characterise environmental conditions and disturbances for climate modelling.
ENERGY BUDGET products
Surface radiation variables useful in a wide range of applications related to land surface processes, including (agro-)meteorology, hydrology and also environmental surveys and climate studies.
WATER CYCLE products
The water cycle plays a major role in land-atmosphere exchanges. These variables are useful for applications such as ecosystem health, crop and forest productivity, regional and global climate impact analysis.
New Sentinels Data Hub for the Copernicus Services
A new dedicated access point for the dissemination of the Sentinel products is in place for the Copernicus Service Project members: the Copernicus Services Data Hub. The copernicus Services Data Hub initially provides access to Sentinel-1 and Sentinel-2 products that have been acquired as of 1 December 2015. The Sentinel-1 historical dataset (which starts with acquisitions dated back to the 3 October 2014) will be gradually published.

The Sentinel-1 data offer for the Scientific Data Hub consists of:
- Level-0 and Level-1 user products for the following acquisition modes:
- Strip Map (SM)
- Interferometric Wide Swath (IW)
- Extra Wide Swath (EW)
- Level-2 user products for the following acquisition modes:
- Wave (WV)
- Interferometric Wide Swath (IW)
- Extra Wide Swath (EW)
Anyone can register online via self-registration. The self-registration process is automatic and immediate. Registration grants access rights for searching and downloading Sentinel-1 products. Sentinel-1 products are available at no cost for anybody. The data available through the Data Hub is governed by the Terms and Conditions of the use and distribution of Sentinel data, which the User is deemed to have accepted by using the Sentinel data.
